Bihar - Region Profile
The largest Eastern Indian state – Bihar lies in the north eastern part of India (between 24°20’11’’ and 27°31’15’’N latitudes and 83°19’50’’ and 88°17’40’’E longitudes) and occupies an area of 9.4 million hectares, out of which total cropped area is 7.5 million hectares. The state has a total population of about 103.8 millions with a density of 880 per sq. km. Annual foodgrain production is 11.9 million tonnes (Mt), with an average productivity of 1460 kg/ha. Table 1 illustrates the current area, productivity and production statistics of major crops in Bihar.
Nutrient consumption in Bihar in the past decade is given in Fig. 2. The consumption of total fertilizer nutrients in Bihar at 1.261 million MT during 2013-14 was 17.4% lower than the previous year’s level. N and P2O5 consumption reduced while K2O consumption increased during the period. The consumption of N at 0.955 million MT and P2O5 at 0.210 million MT during 2013-14 declined by 14.1% and 35.6%, respectively, over 2012-13. The consumption of K2O at 0.096 million MT increased by 6.6% during the period. Consequently, NPK use ration changed significantly from 12.3:3.6:1 during 2012-13 to 9.9:2.2:1 during 2013-14. The consumption of total nutrients declined both in Kharif and Rabi seasons by 18.8% and 16.4%, respectively over the previous seasons. Kharif : Rabi share in consumption of total nutrients remained unchanged at 41:59 during 2013-14. The consumption of total nutrients per hectare of gross cropped area declined from 199.7 kg during 2012-13 to 164.9 kg during 2013-14. Using the area and production of major crops, the total nutrient (N, P2O5 and K2O) removal by each crop was calculated and a nutrient balance sheet was prepared (table 2).
But it is quite evident from the diagram that fertilizer consumption in the state is still highly skewed towards N. This sub-optimal and imbalanced nutrient usage is causing nutrient mining leading to depletion of inherent soil fertility. An N-driven fertilizer use pattern is a major cause of P, K and S mining in most states of India. Using only, or largely using N, the farmers are making their soils highly deficient in P, K, S and other nutrients, holding back yields, profits and N-use efficiency itself.
Table 1: Latest Crop Production Statistics of Bihar- 2012-13
| Parameters | Rice | Wheat | Maize | Total Cereals | Gram | Total Pulses | Total Foodgrains | Total Oilseeds | Sugarcane | Jute# |
| Area | 3298.9 | 2207.7 | 685.6 | 6220.3 | 61.5 | 515.8 | 6736.1 | 128 | 250.3 | 123.1 |
| Production | 7529.3 | 5357.2 | 2475.9 | 15396.8 | 86.2 | 542.8 | 15939.6 | 143.3 | 12741.4 | 1490.2 |
| Productivity | 2282 | 2427 | 3611 | 2475 | 1402 | 1052 | 2366 | 1120 | 50896 | 2180 |
Table 2: Nutrient balance sheet for major crops of Bihar (2012-13)
| Crop | Area (in '000 ha) | Production (in '000 tonnes) | Nutrient Removal (kg/tonne) | Total Removal (tonnes) | ||||
| N | P2O5 | K2O | N | P2O5 | K2O | |||
| Rice | 3298.9 | 7529.3 | 20.1 | 11.2 | 30 | 151338.9 | 84328.16 | 225879 |
| Wheat | 2207.7 | 5357.2 | 24.4 | 8.6 | 32.8 | 130715.7 | 46071.92 | 175716.16 |
| Maize | 685.6 | 2475.9 | 8.2 | 3.1 | 15.5 | 20302.38 | 7675.29 | 38376.45 |
| Total Pulses | 515.8 | 542.8 | 40 | 5 | 20 | 21712 | 2714 | 10856 |
| Total Oilseeds | 128 | 143.3 | 54 | 14 | 46 | 7738.2 | 2006.2 | 6591.8 |
| Sugarcane | 250.3 | 12741.4 | 1.7 | 0.2 | 2 | 21660.38 | 2548.28 | 25482.8 |
| Jute | 123.1 | 1490.2 | 23.5 | 13 | 41.7 | 35019.7 | 19372.6 | 62141.34 |
Total removal by major crops | 388487.3 | 164716.5 | 545043.55 | |||||
Total fertilizer consumption in Bihar | 1111160 | 325600 | 90030 | |||||
Consumption * Efficiency factor | 444464 | 97680 | 63021 | |||||
Balance/Deficit | 55976.73 | -67036.45 | -482022.55 | |||||
*Crop production and fertilizer use data are retrieved from Fertiliser Statistics, 2013-14, The Fertiliser Association of India, New Delhi

Dr. Watson along with Dr. Dutta, Dr. Majumdar, and other scientists and farmers visiting farmers field

Dr. Sudarshan Dutta during his field visit at Samastipur, Bihar.

One person carrying a display board of Nutrient Expert at Bihar.

IPNI and University Scientists are vising farmer's field at Bihar, Eastern India.

Dr. B.P. Bhat is adressing his Chief Guest speech as the state government officials gathered at Patna, Bihar to learn Nutrient Expert.

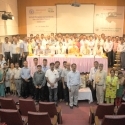
Participants of the Nutrient Expert Workshop at the End of the Session

Participants from State Government officials and membe company staffs at Nutrient Expert Training at Patna, Bihar.